

Everything you need to understand the market — in one place.
No more jumping between ten tabs and hoping you didn’t miss something. Meaterm puts market prices, the news that actually matters, and what large investors are doing all on one screen — so you understand what’s happening, not just watch numbers change.
Research workflows
Go from a question to an answer without switching apps ten times — scan, chart, and understand, all in one flow. Research only: no order execution, no custody of your funds, ever.
Market intelligence
See the signals that matter, not just the price — so your next move is grounded in the full picture, not a hunch.
Workspace control
Downloads, alerts, account settings, and referrals — everything about your Meaterm account in one consistent place.
A look inside the terminal
Real screens from the web terminal, running on third-party market data (crypto live; equities delayed or end-of-day) and public-domain sources — research and analysis only, never order execution.
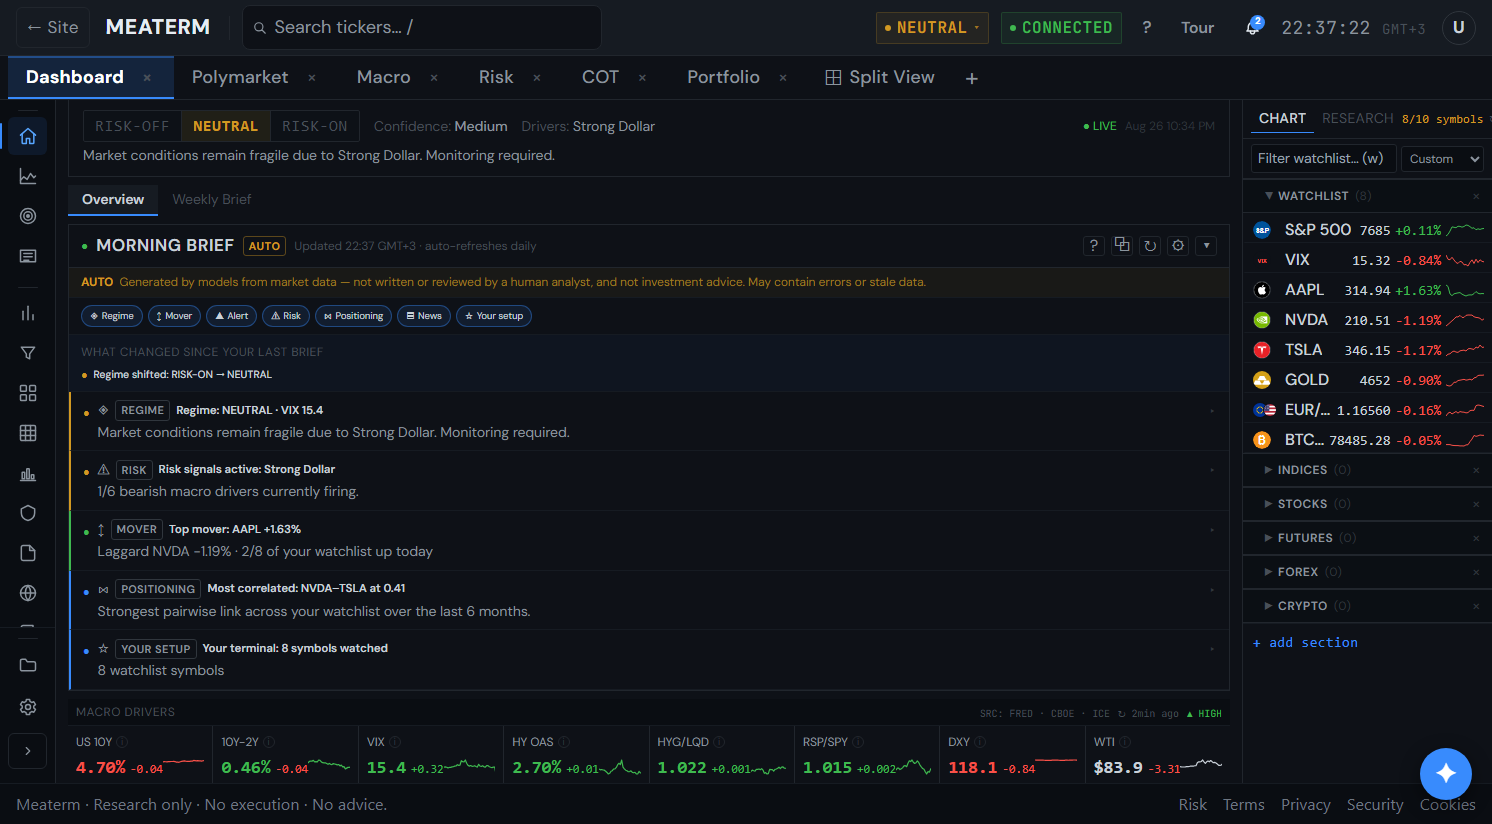
Dashboard & market regime
A live cross-asset overview — regime read, risk gauges, movers and your watchlist — so every session starts with the full picture on one screen.
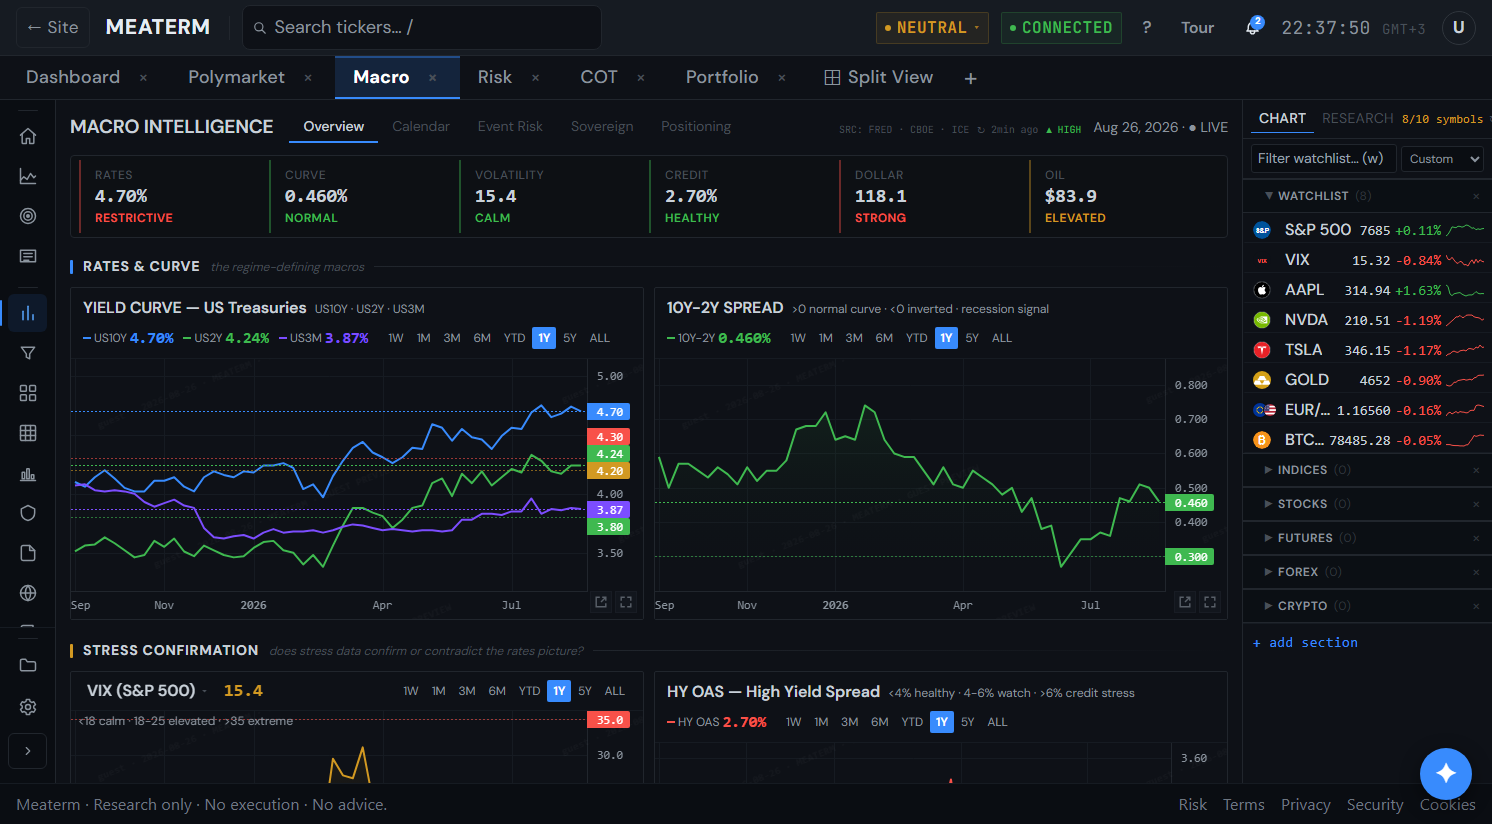
Macro intelligence
Rates, the dollar, credit, breadth and volatility from public-domain sources (FRED, ECB, Treasury). Read the macro backdrop without stitching a dozen feeds together.
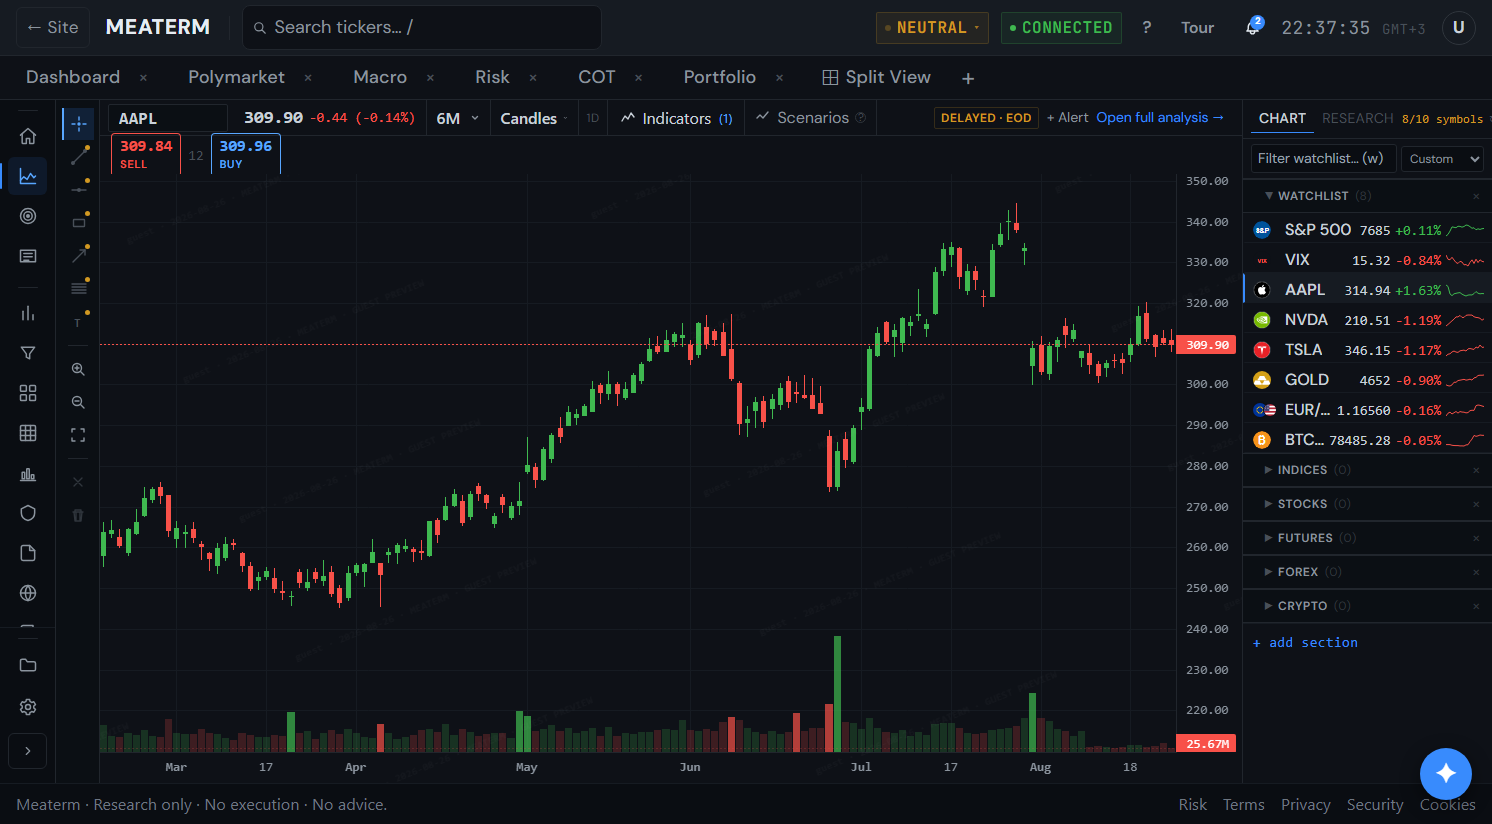
Professional charting
Multi-timeframe candles with drawing tools and indicators, running on the same data that drives the rest of the terminal.
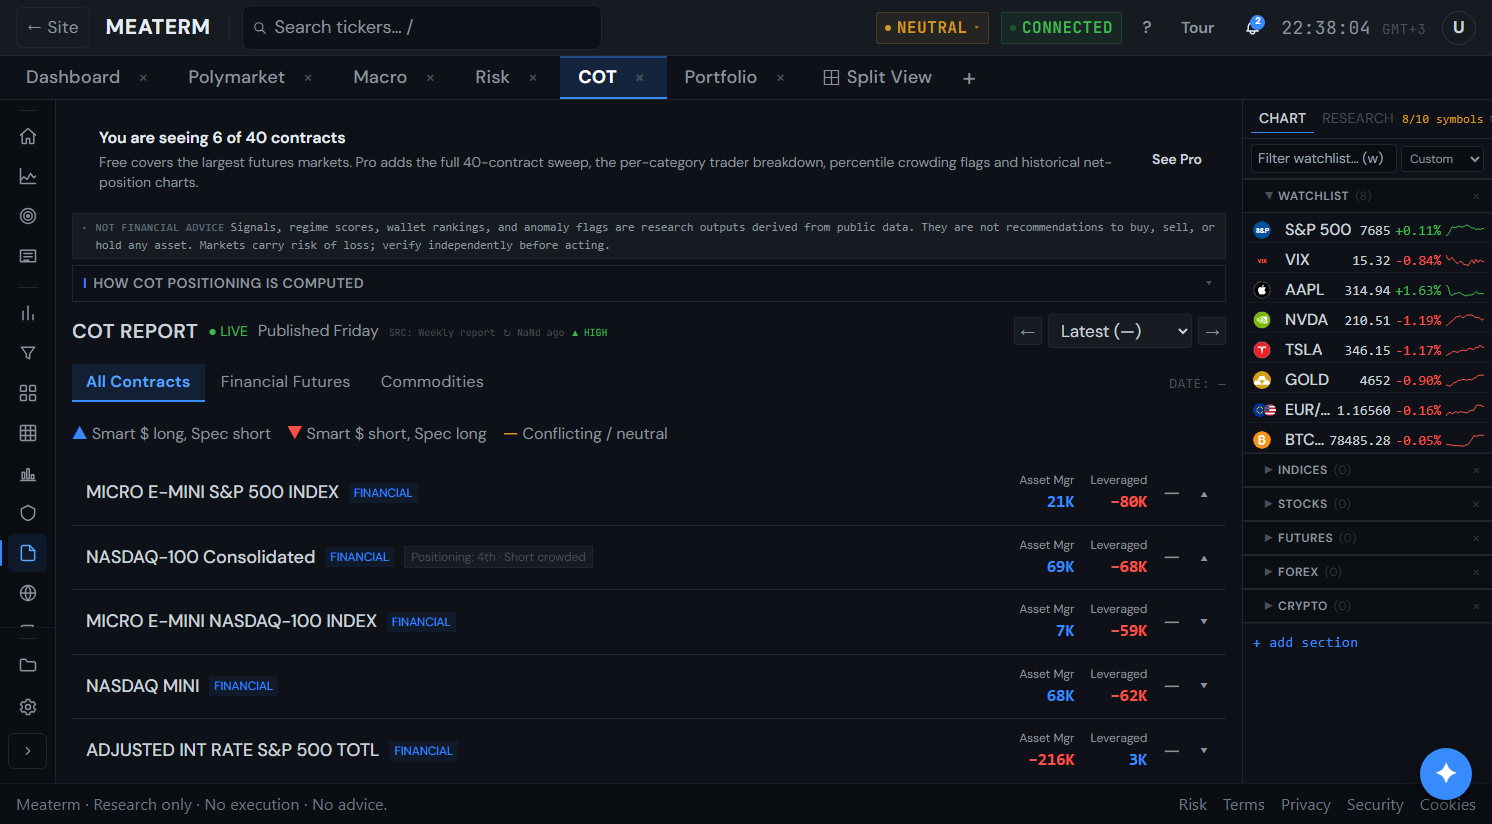
COT positioning
CFTC Commitments-of-Traders by trader category, with week-over-week shifts and crowding extremes across the major futures markets.
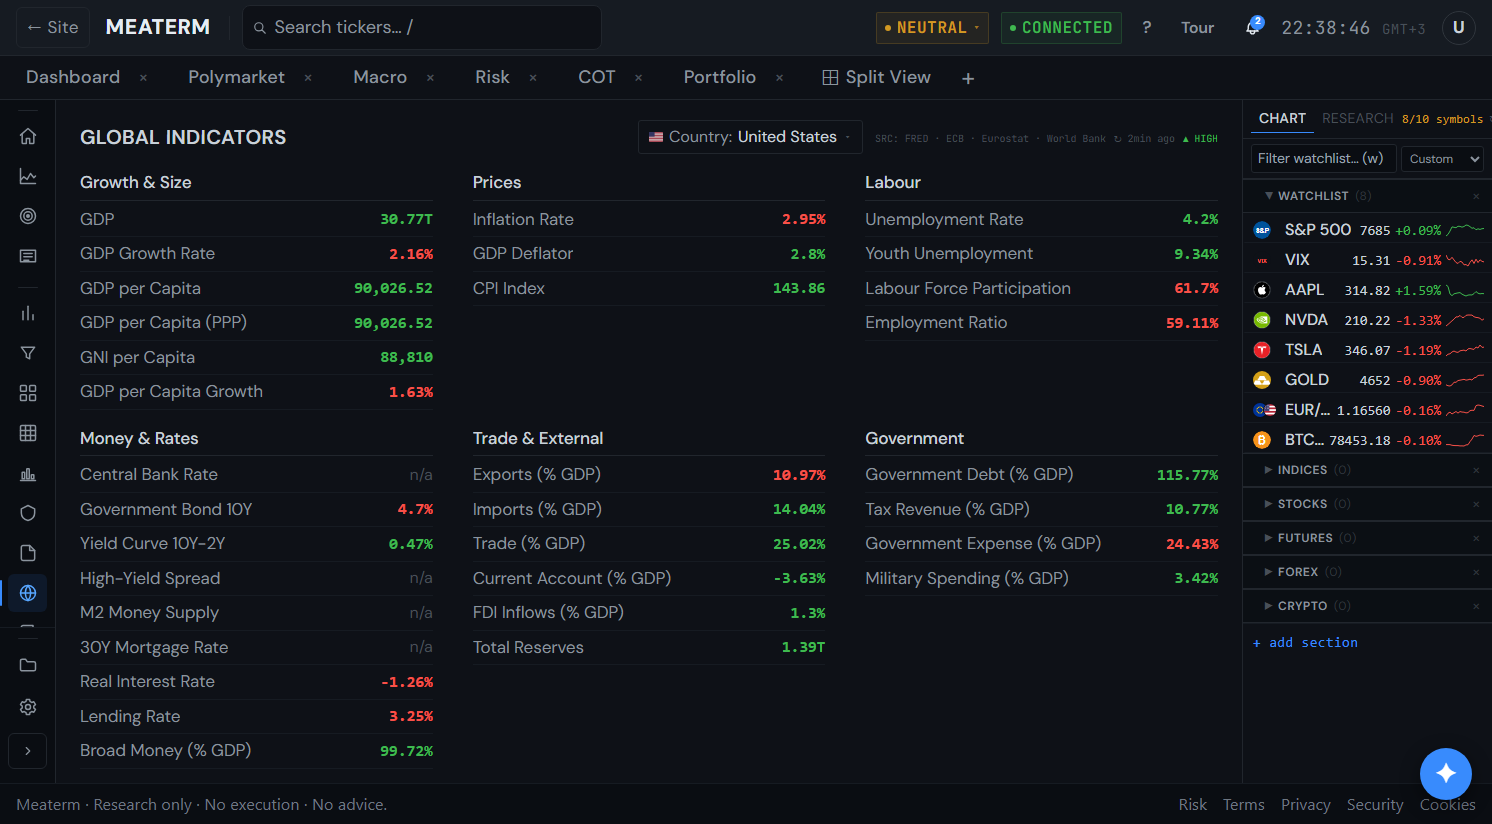
Global indicators
GDP, inflation, employment and rates across the G20 from FRED, the World Bank and Eurostat — the structural backdrop behind the price action.
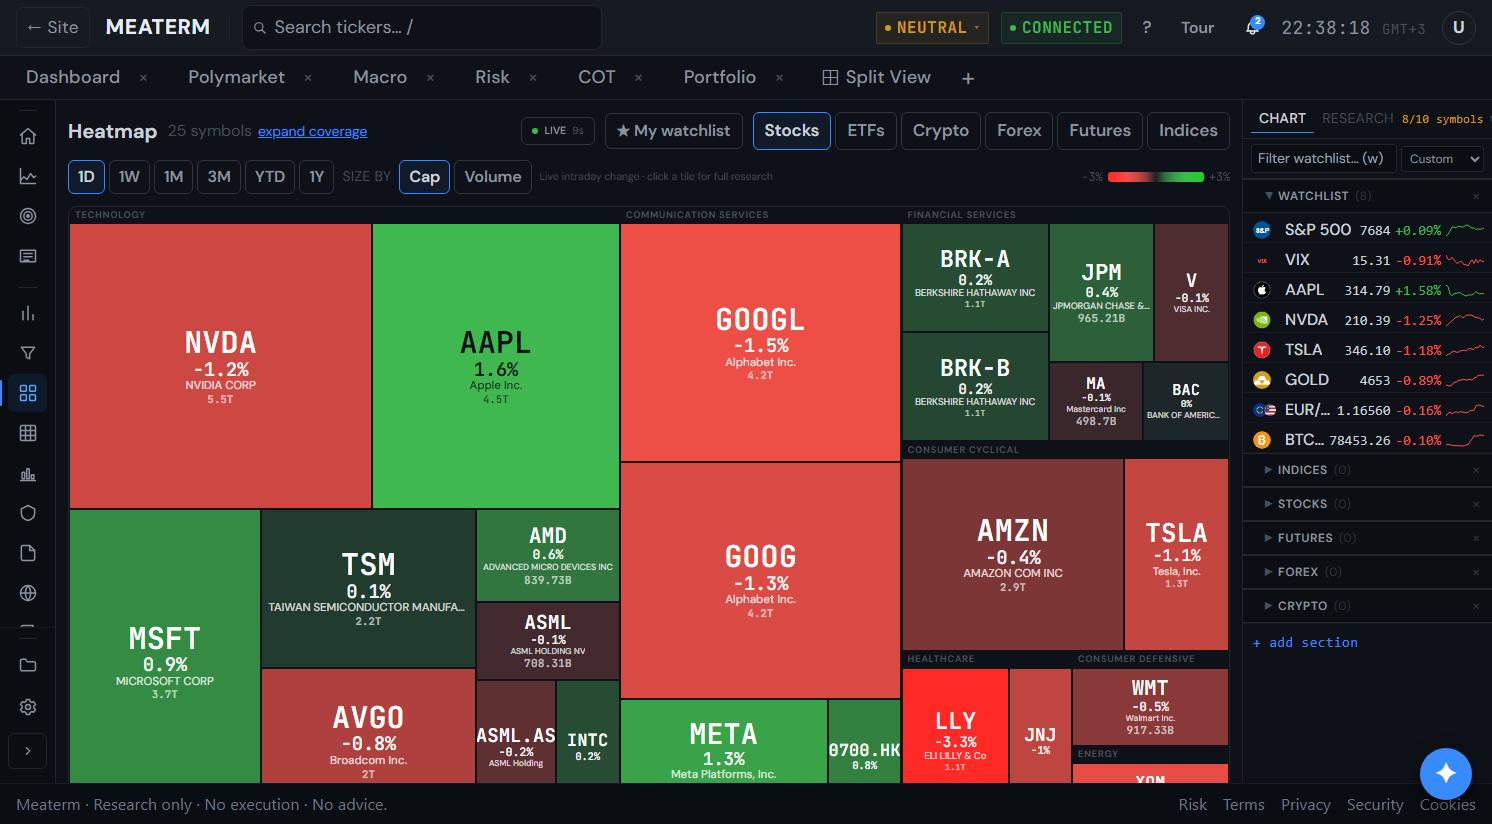
Market heatmap
The whole market on one screen — every sector and name colour-coded and sized by weight, from intraday to a full year. See where money is rotating at a glance, then click any tile straight into research.
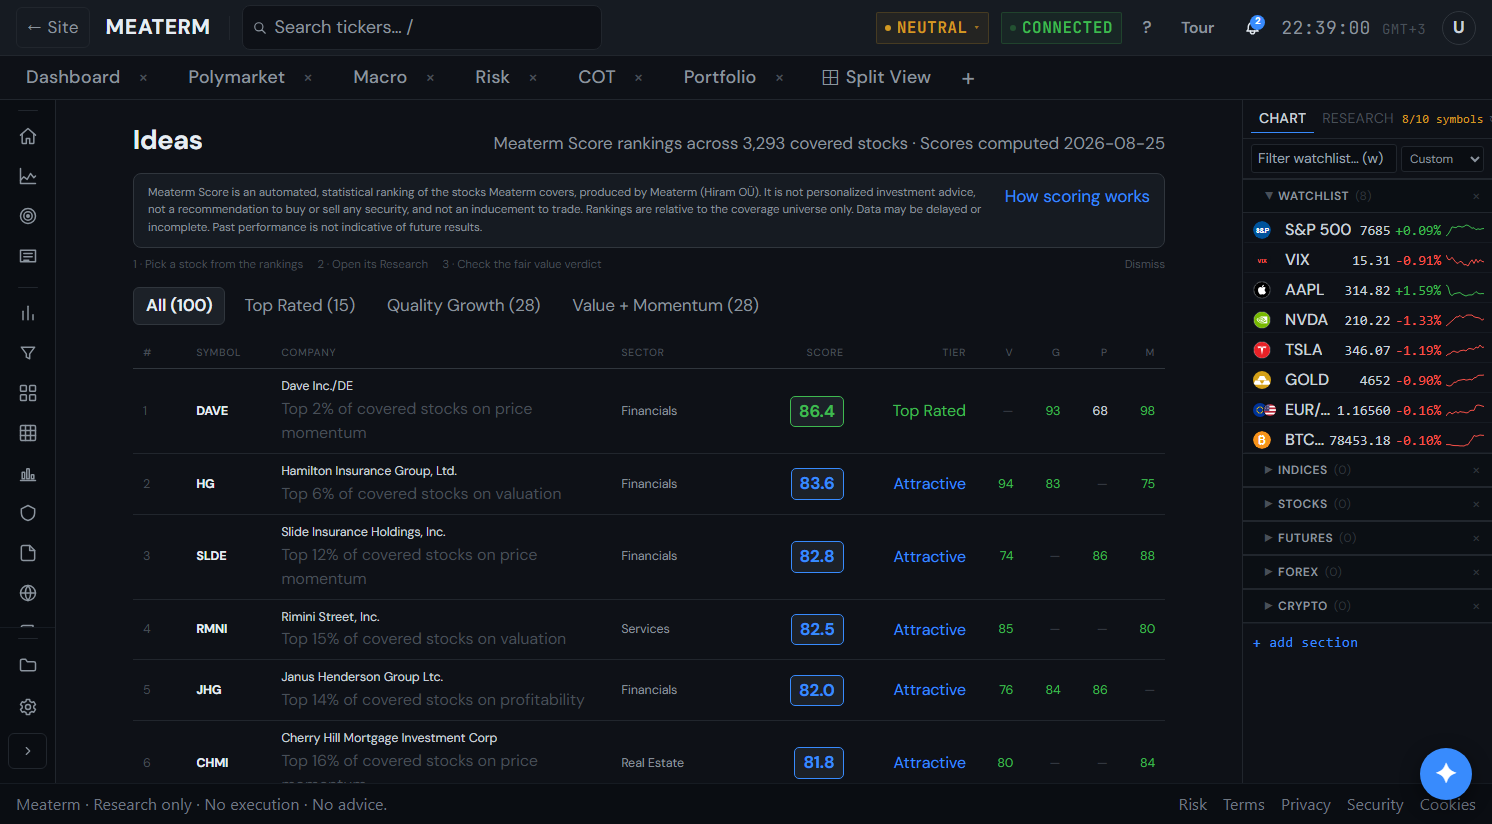
Ideas & Meaterm Score
An automated, statistical ranking of every covered stock on value, growth, profitability and momentum — a starting shortlist of where to look, clearly labelled as research, not advice.
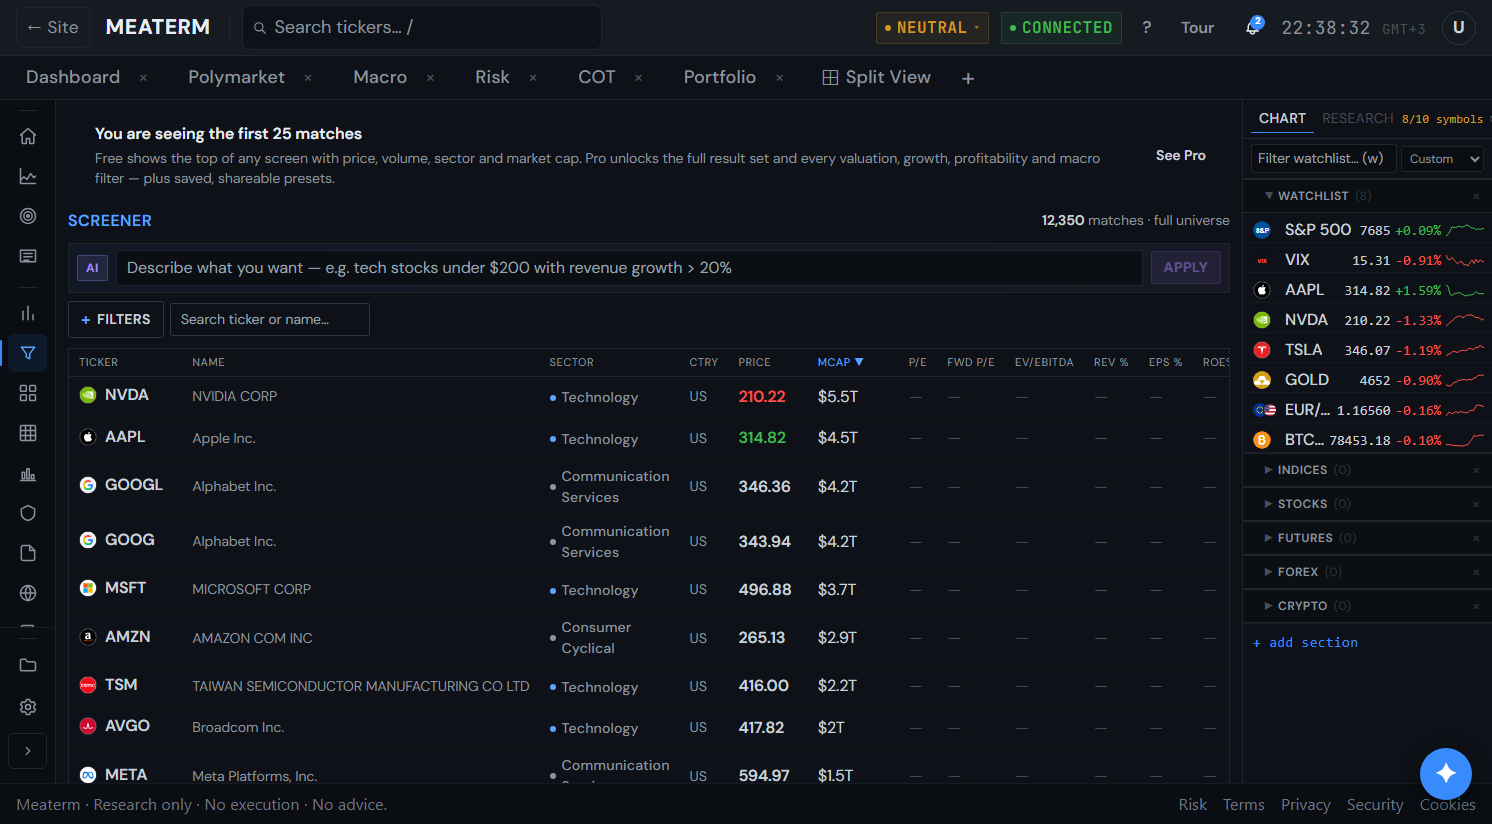
AI screener
Describe what you want in plain English — “tech stocks under $200 with revenue growth over 20%” — and screen the full universe on fundamentals, valuation and momentum in one step.
Ready to see it for yourself?
No credit card, no sales call — create a free account and look around, or open the web terminal right now.